Create New Report
Steps to create a new dashboard/report in Chakra Chat
Overview
How to Create a Report in Chakra Dashboard: This guide walks you through the process of creating a new dashboard and configuring visualizations in Chakra Dashboard to generate insightful reports.
Step 1: Create a New Dashboard
- Navigate to the Chakra Dashboard.
- Click the ➕ icon and select Create New Dashboard.
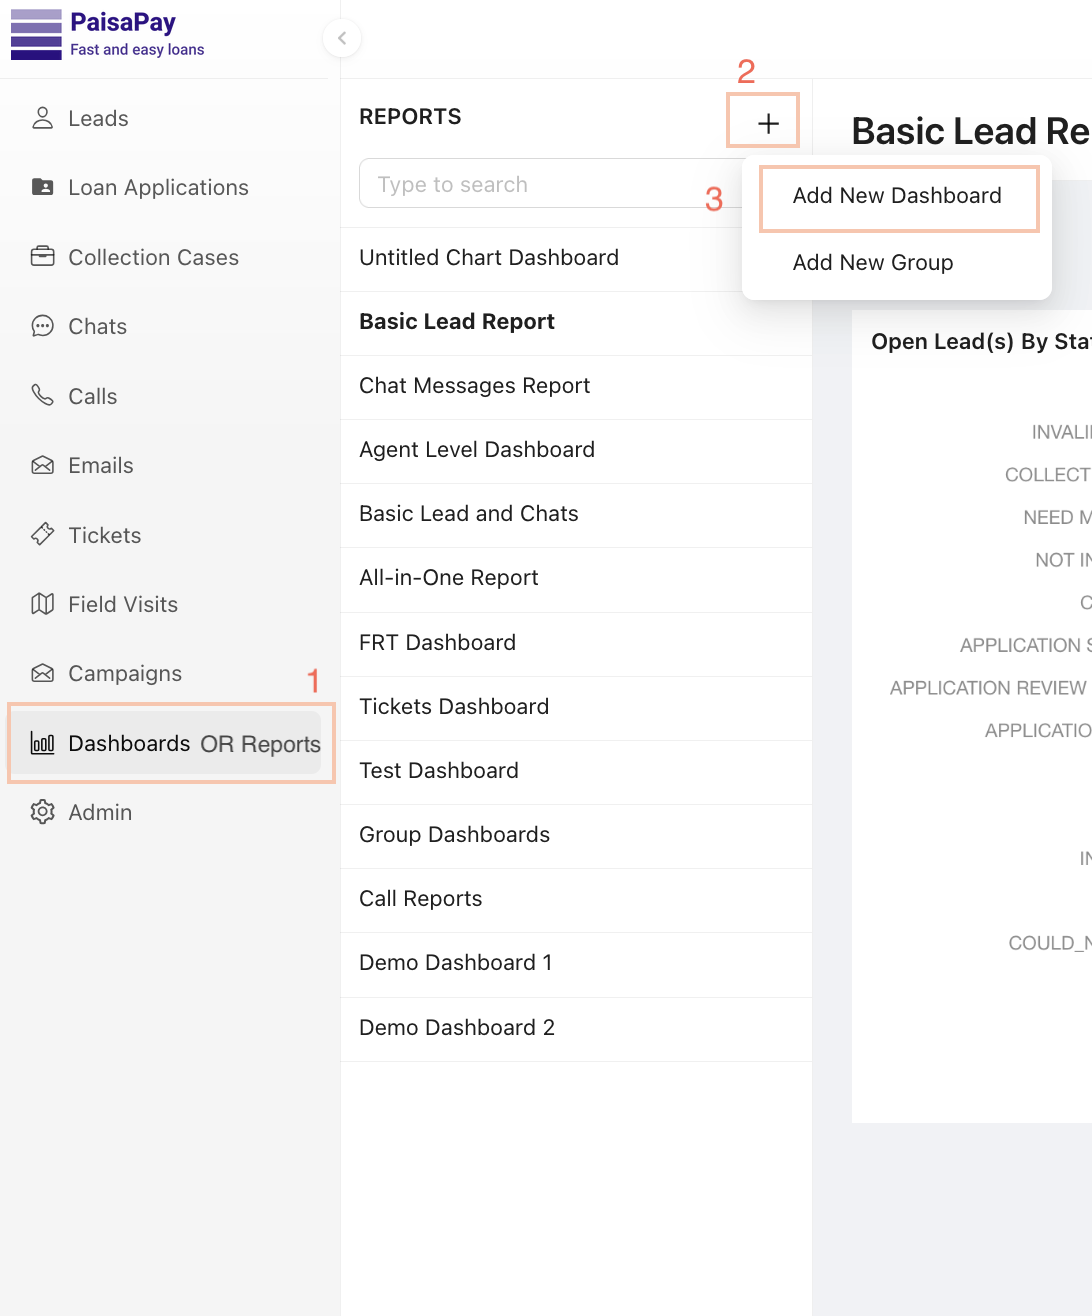
- A blank dashboard is created.
3.1 Enter a Name for the dashboard.
3.2 Click New Visualization to start building a visualization.
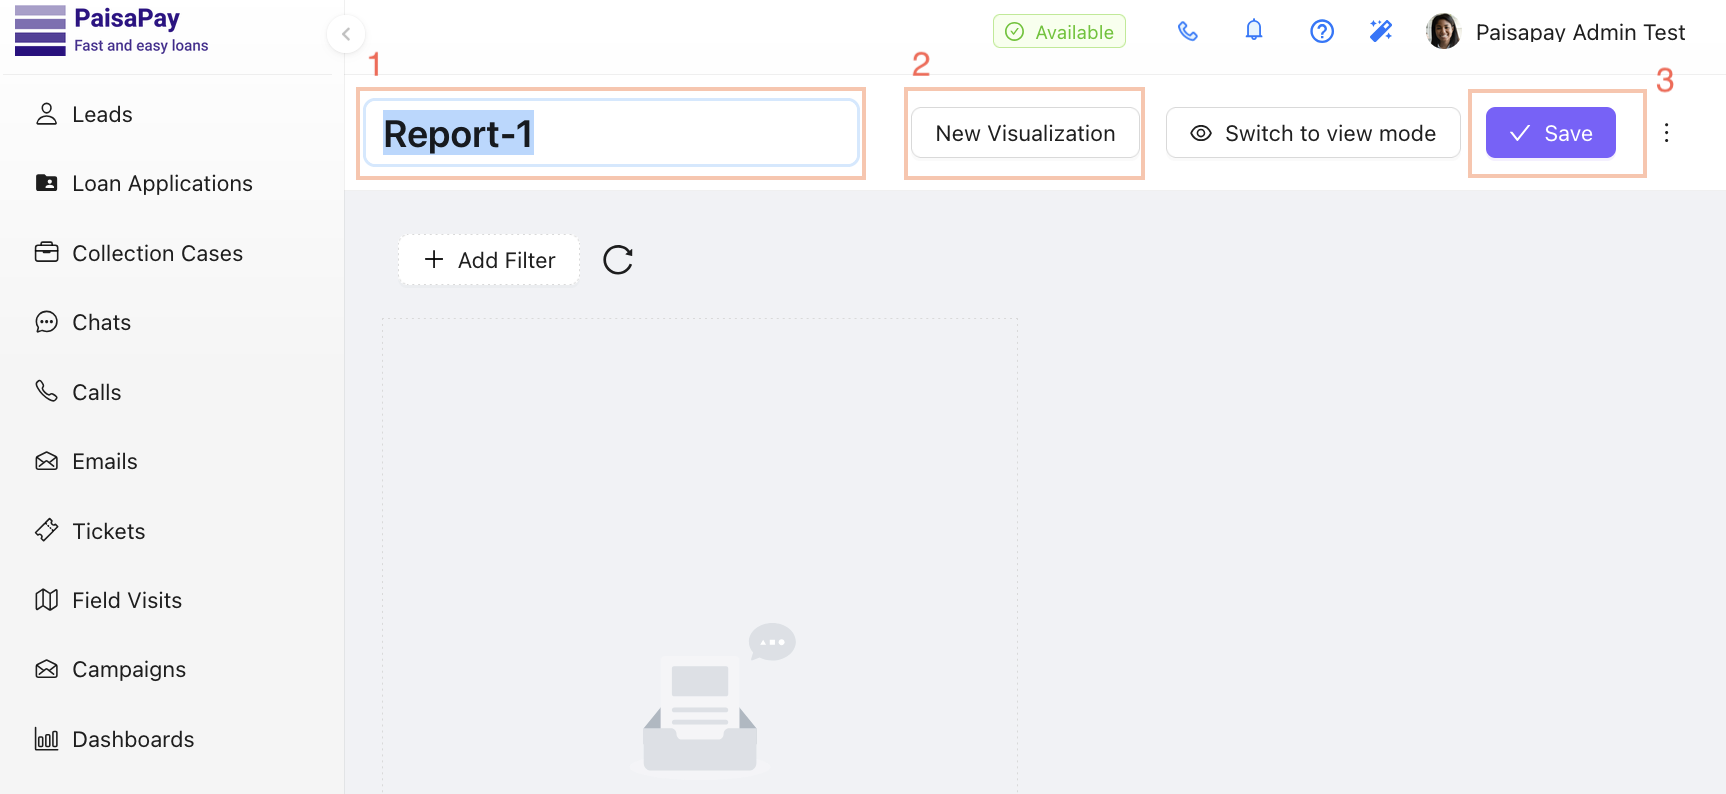
- Click Save to save the dashboard.
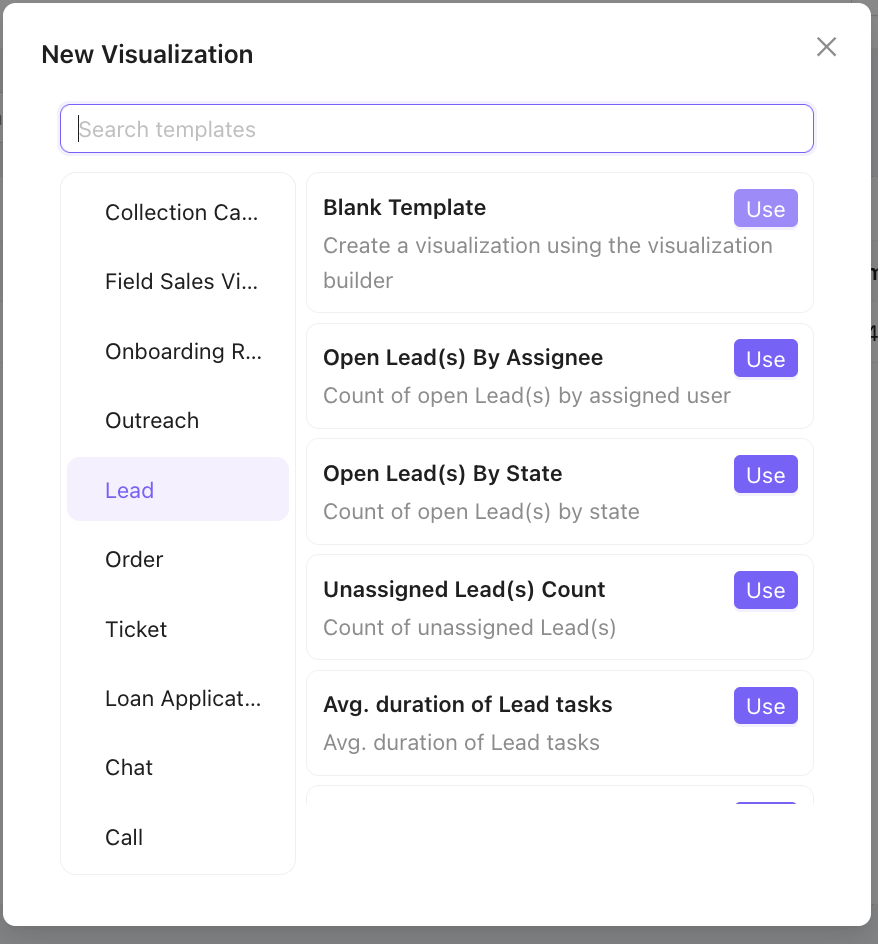
- Select a visualization template by clicking Use to create a blank visualization in the dashboard builder.
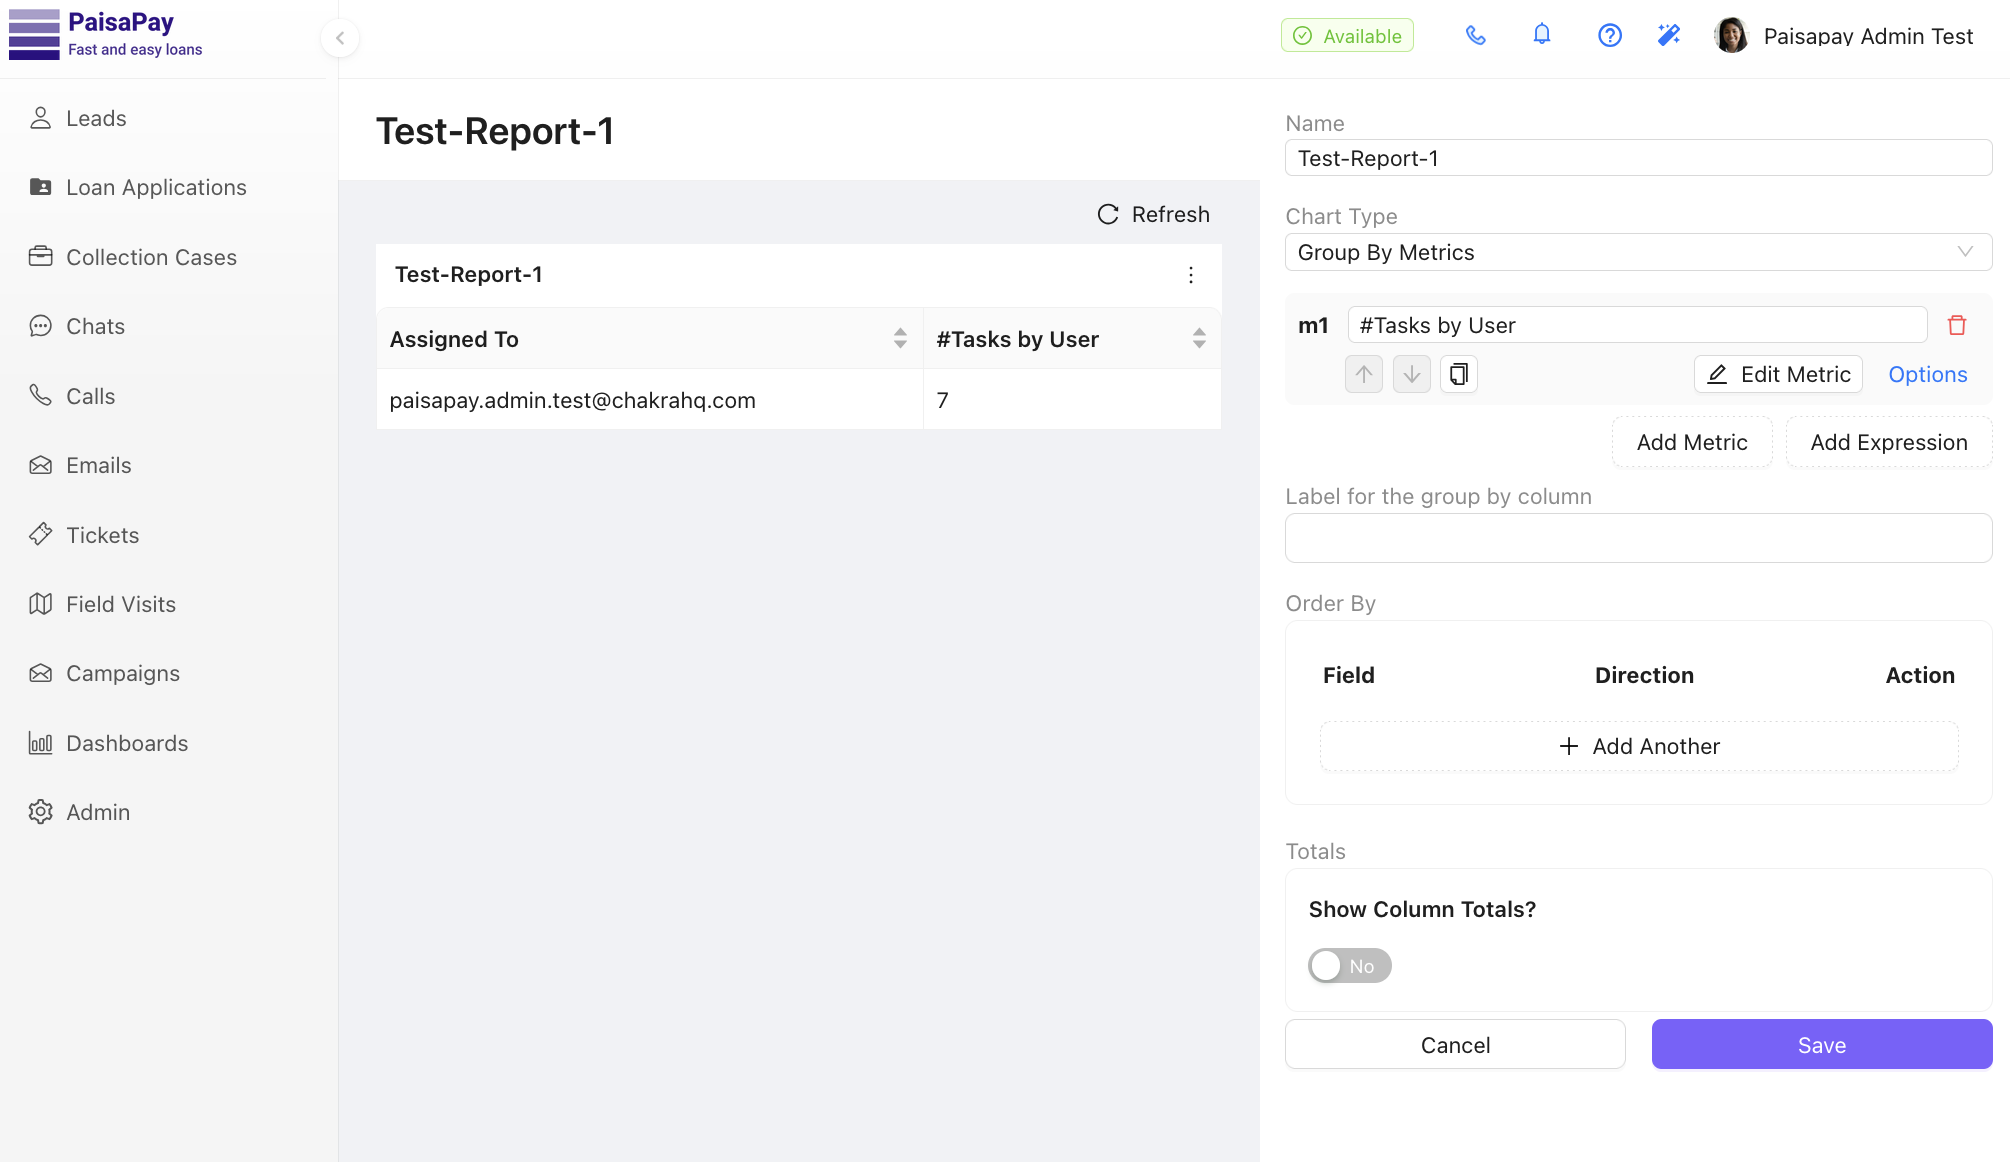
Step 2: Configure the Visualization
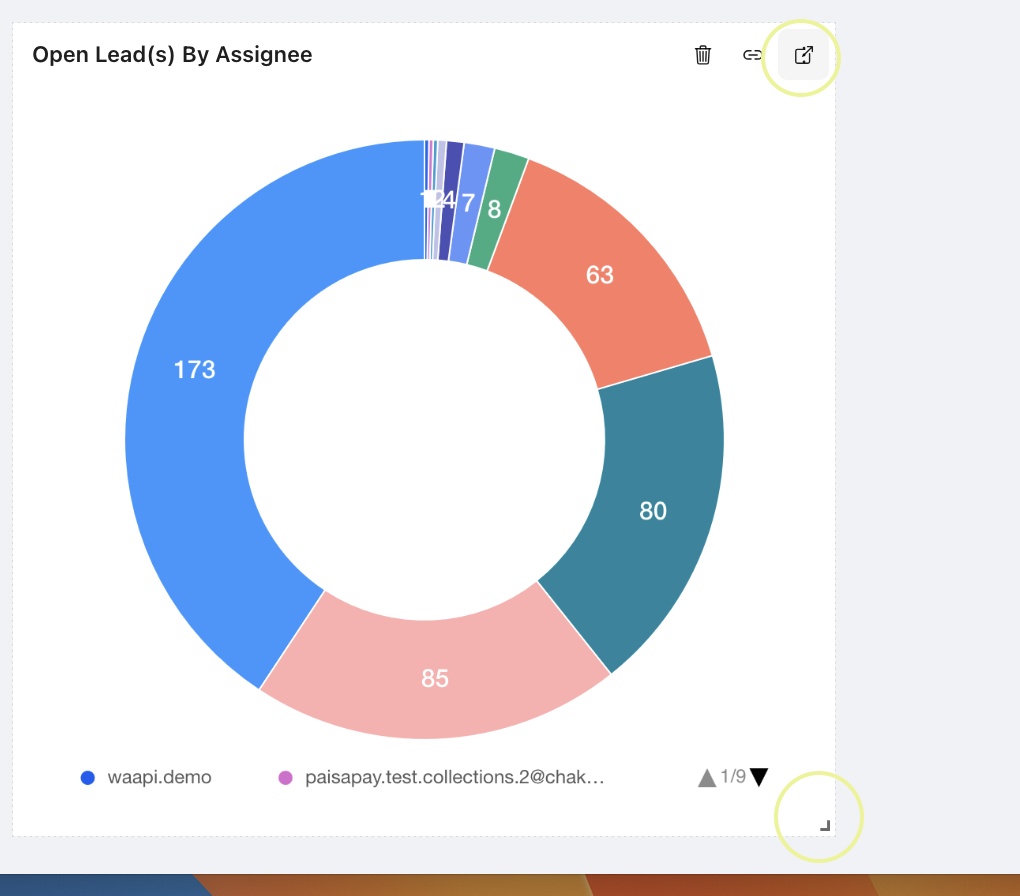
- Click the ↗️ icon on the blank visualization to open the visualization builder in a new window.
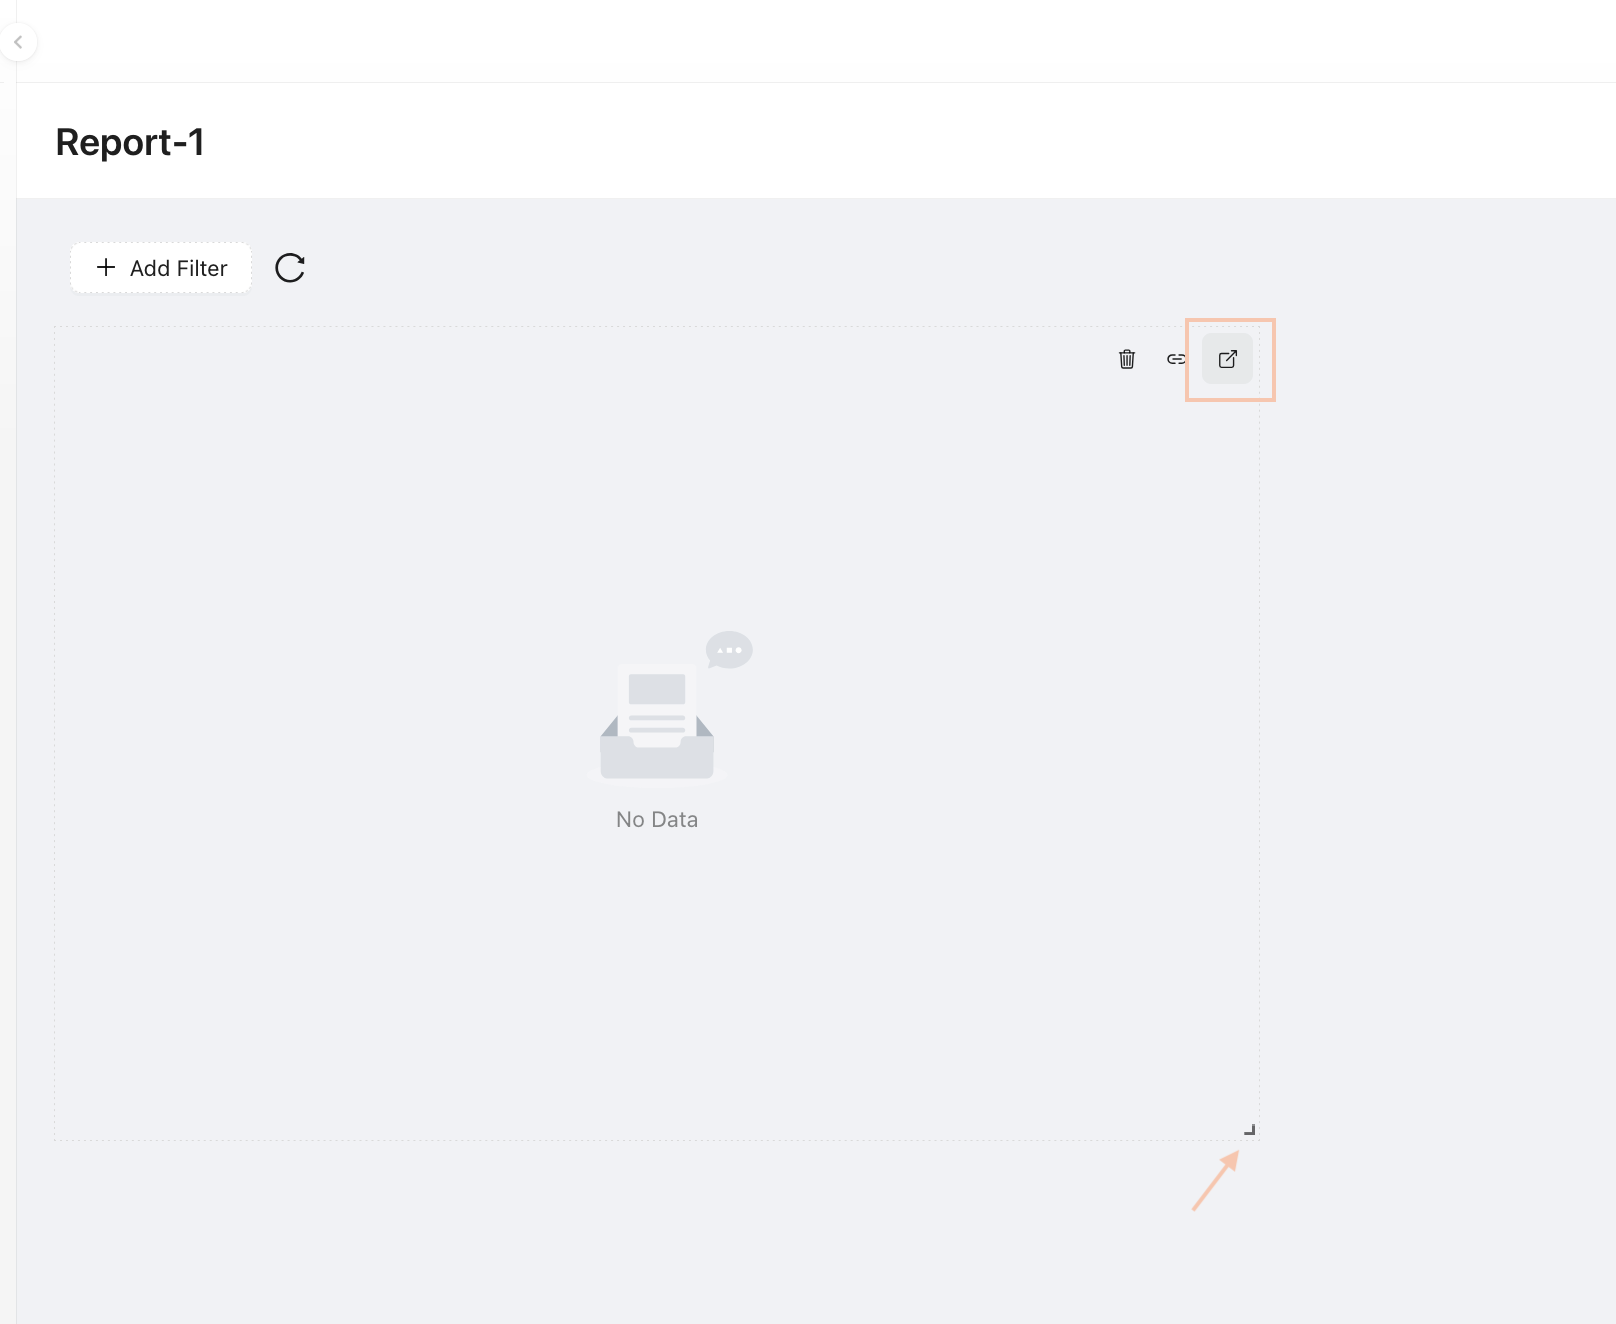
- Configure the visualization with the following settings:
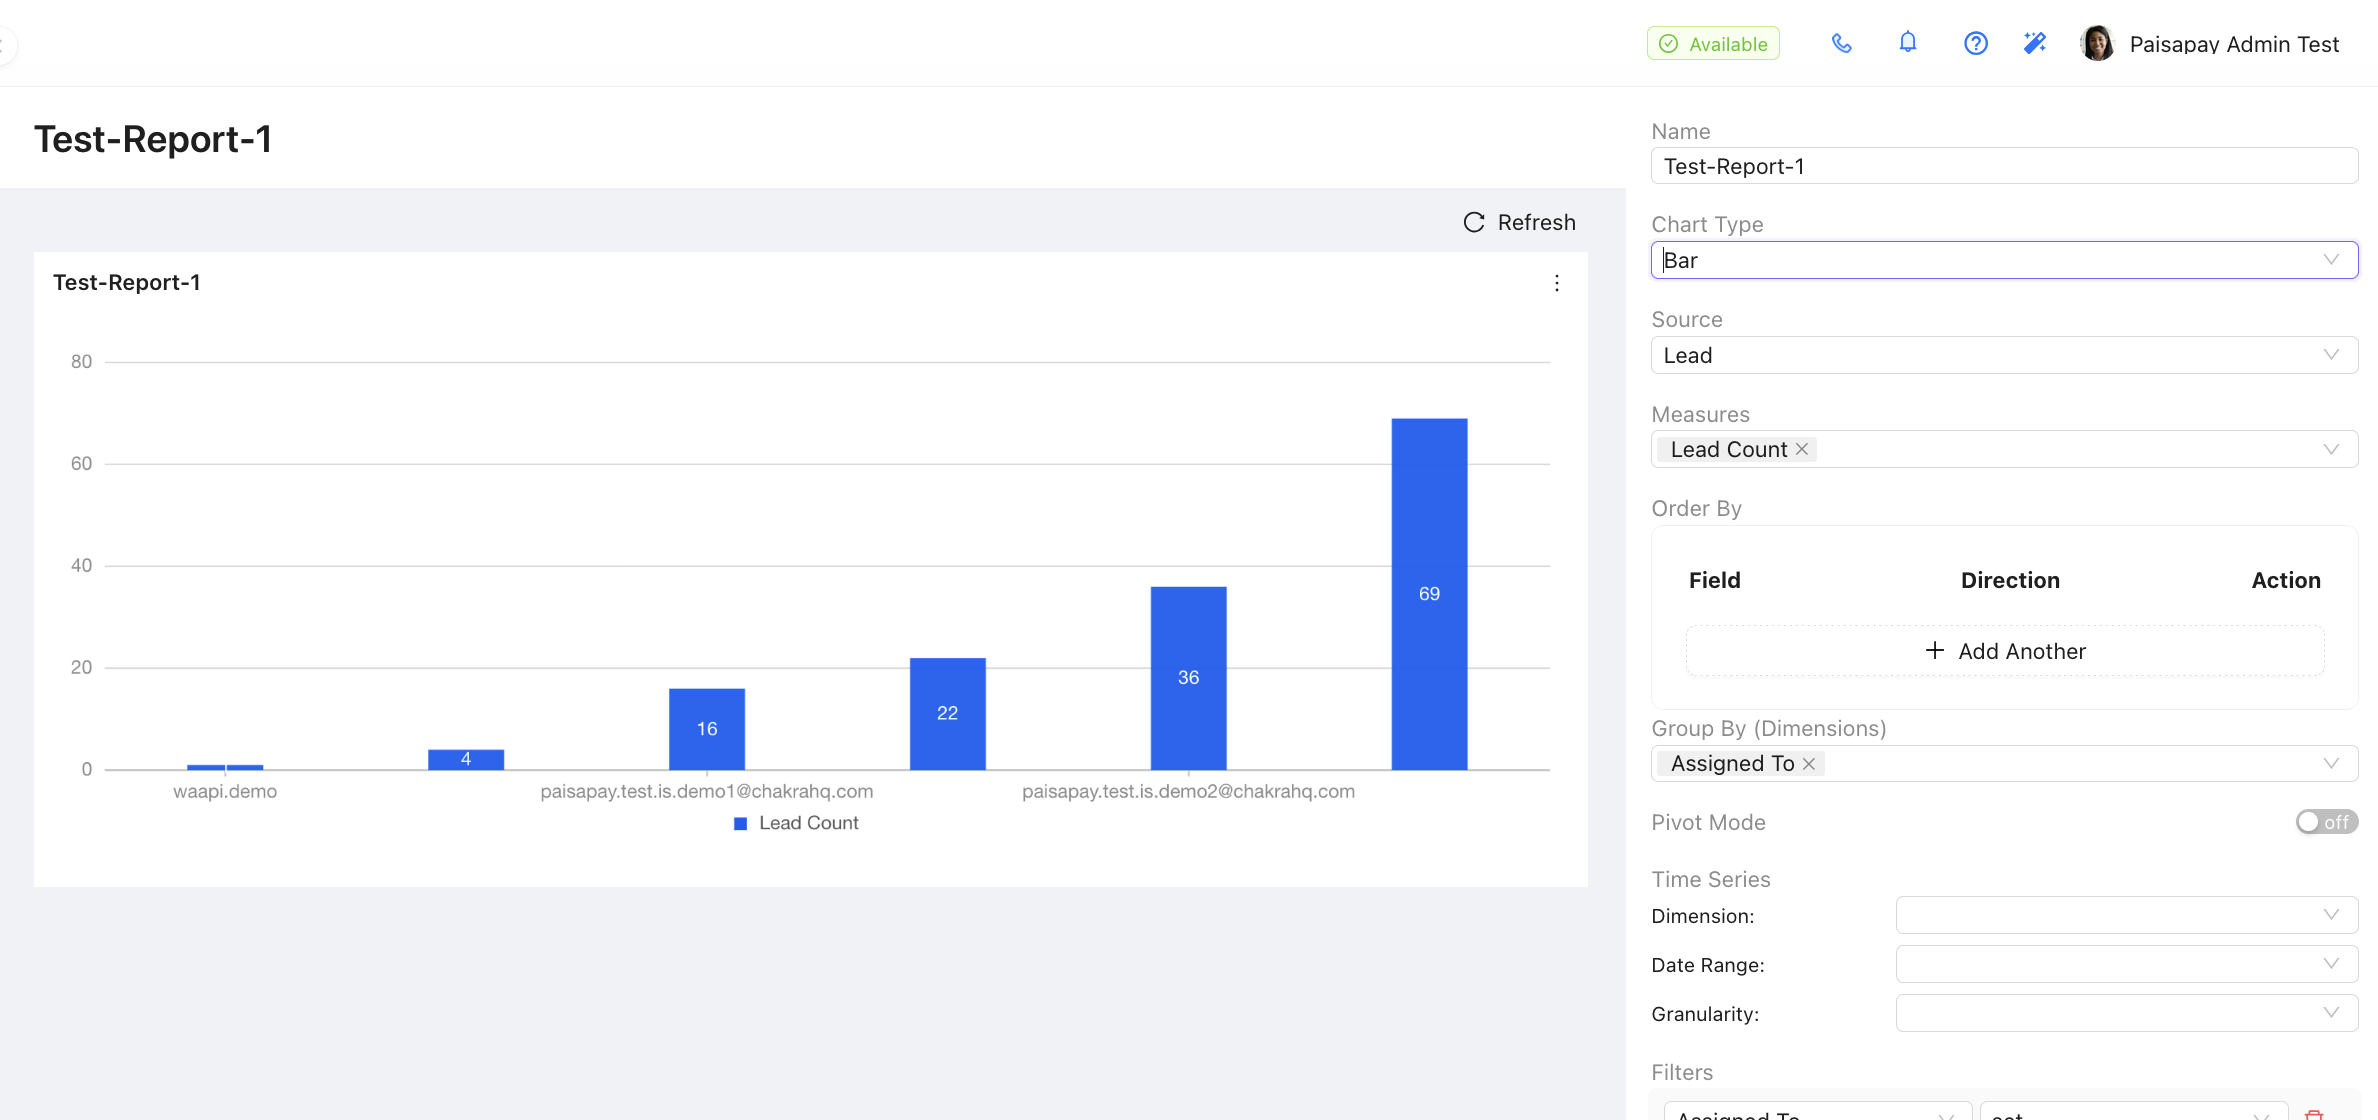
- Name: Provide a descriptive name for the visualization.
- Chart Type: Choose the visual representation (e.g., table, bar graph, donut chart).
- Data Source: Select the relevant data source (e.g., Leads, Tasks, Chat).
- Group By: Use this option to summarize data by specific groups. For example, to create a report of leads per user, select AssignedTo in the Group By option. This will generate a report summarizing leads assigned to each user.
- Additional Configurations (as needed):
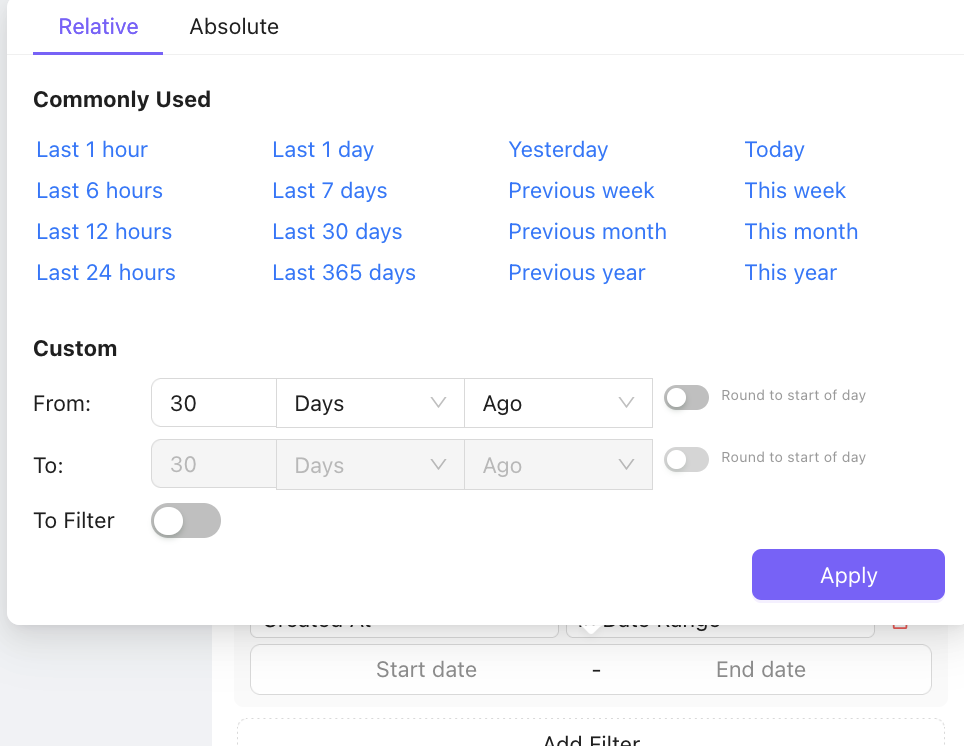
- Apply filters to limit data by specific attributes (e.g.,
createdAt==30 Daysto include only leads created in the last 30 days)
- Set ordering for values (ascending or descending).
- Include column totals if required.
- Note: Adding data filters is recommended to optimize dashboard performance by limiting the volume of data processed. For example, filtering leads to those created in the last 30 days ensures faster query execution.
- Click Run in the visualization builder to test the visualization.
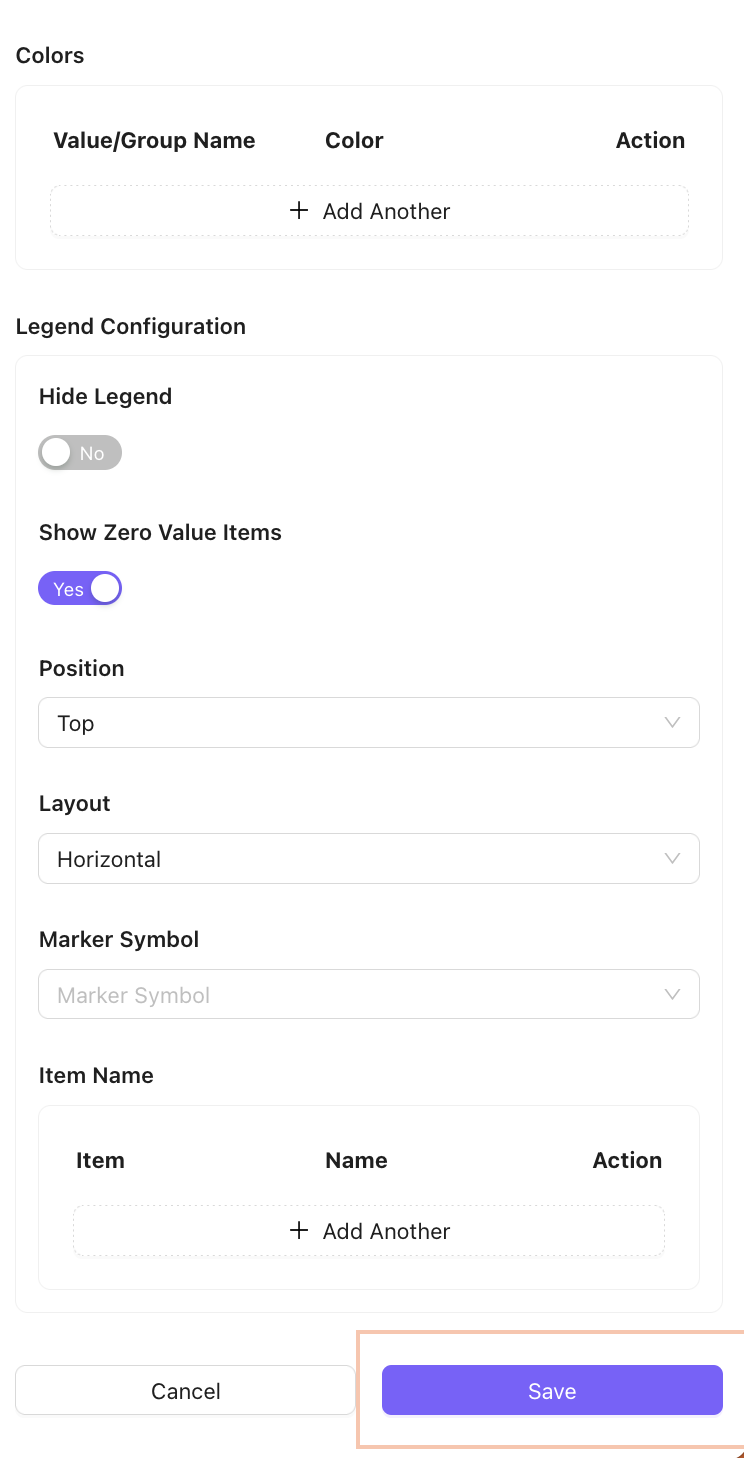
- Click Save to save the configured visualization.
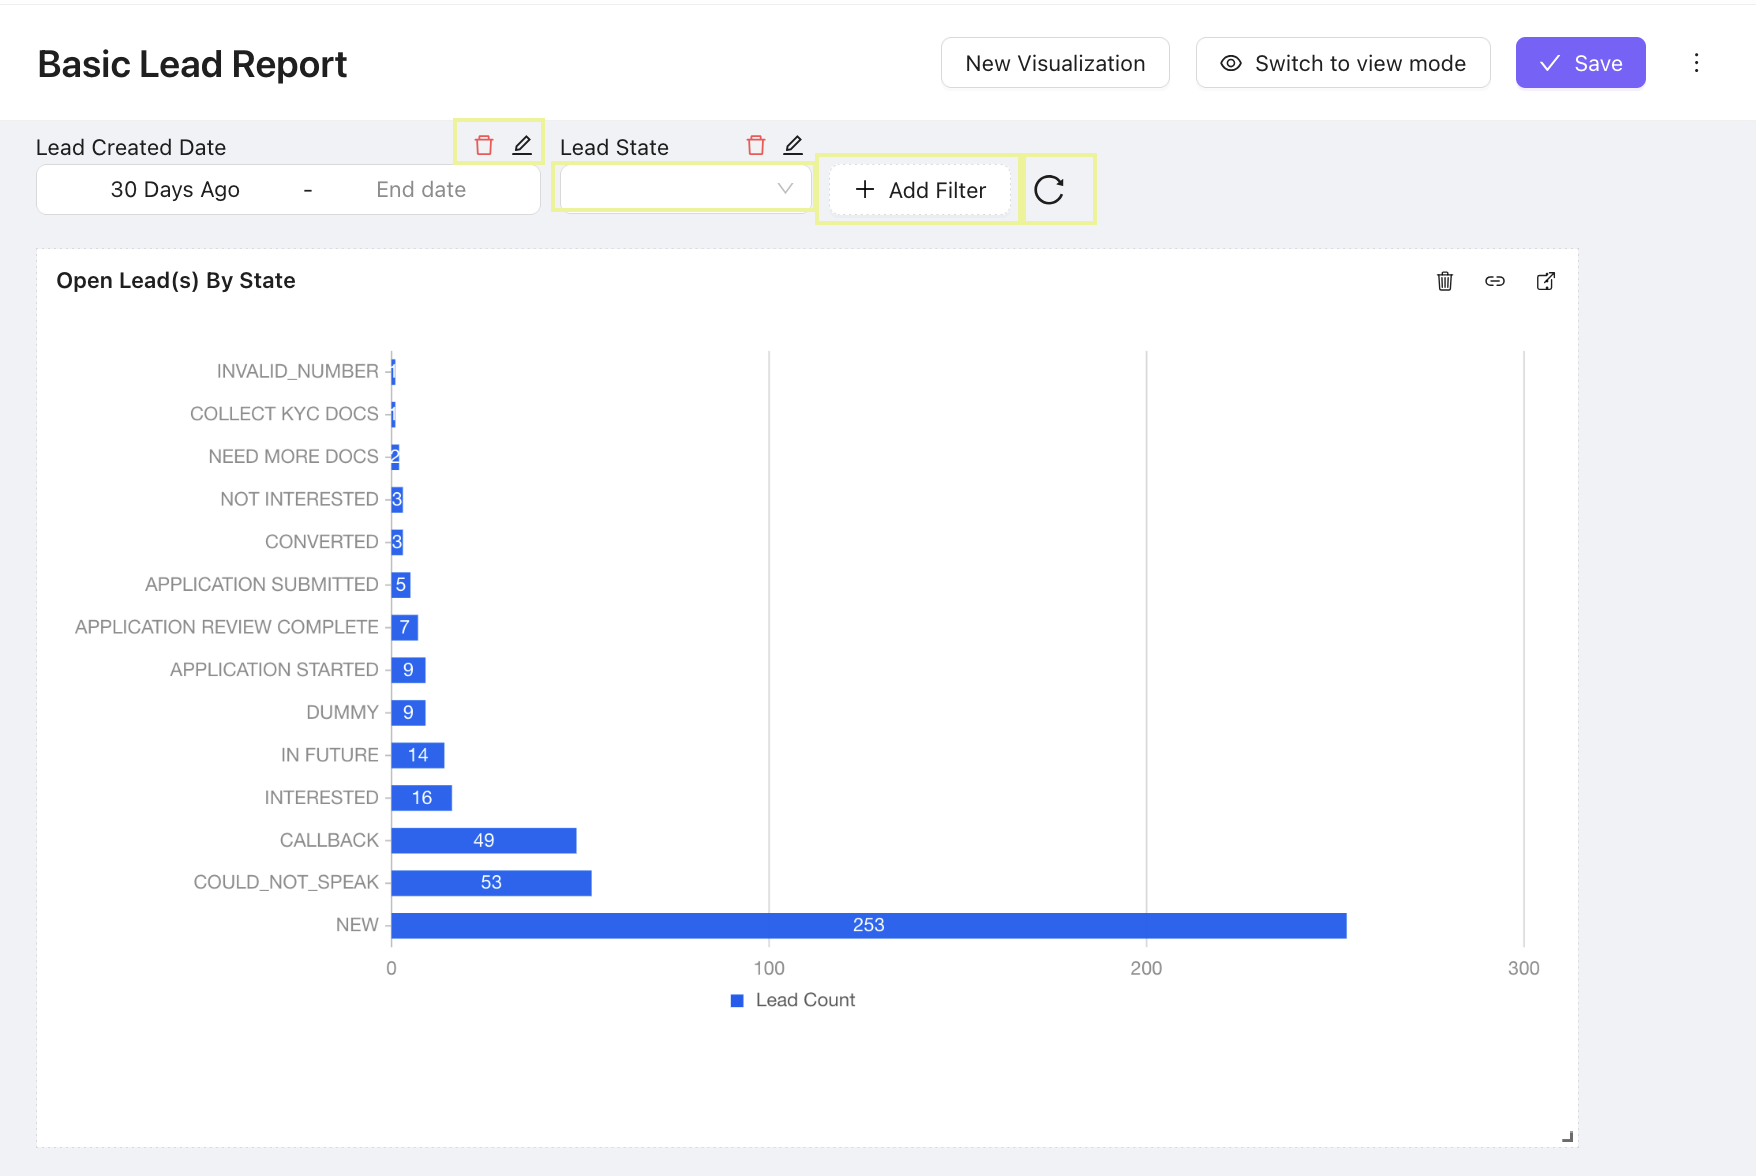
Step 3: Complete the Dashboard Setup
- Return to the dashboard.
- Add more visualizations by repeating the steps in Step 2 as needed.
- Add dashboard-level filters if required:
- Link dashboard filters to visualization filters to ensure consistency.
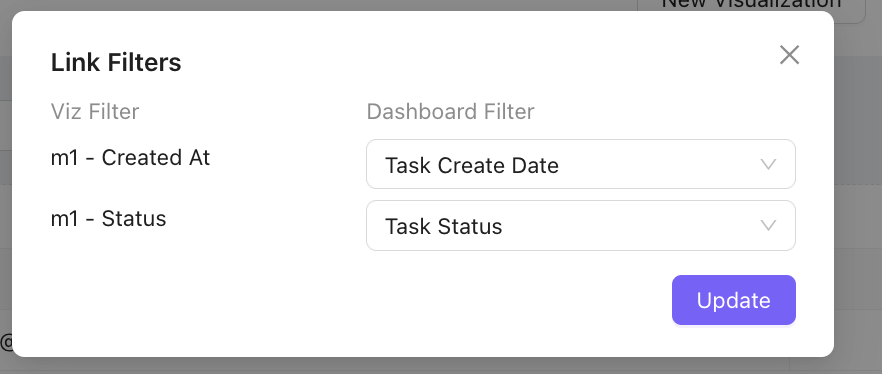
- Set default filters to apply automatically when the dashboard is viewed.
- Resize or rearrange visualizations on the dashboard for optimal layout.
- Switch to View Mode to preview the dashboard.
- Click Save to finalize the dashboard setup.
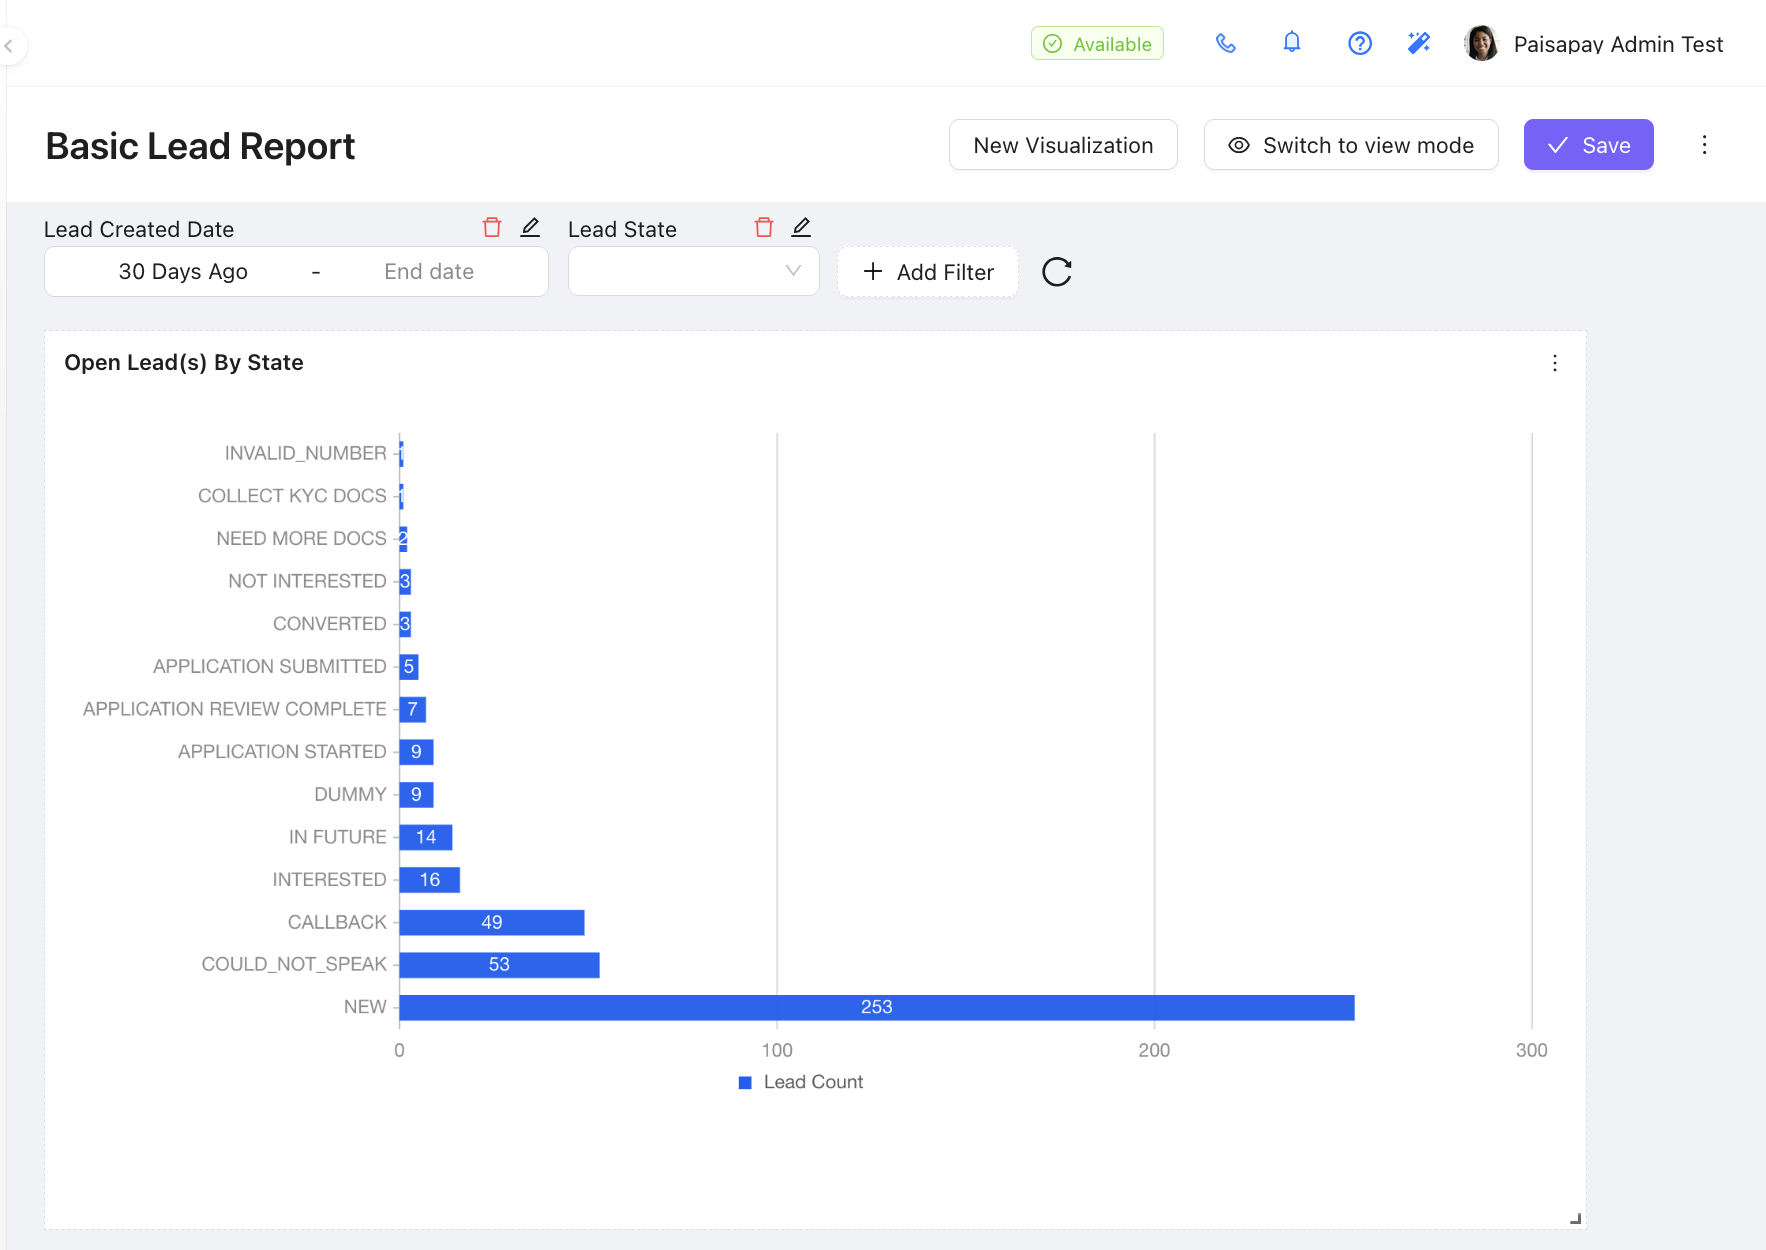
Your Dashboard is Ready!
The dashboard is now set up and ready for use. You can revisit and edit the dashboard or visualizations at any time to refine your reports.