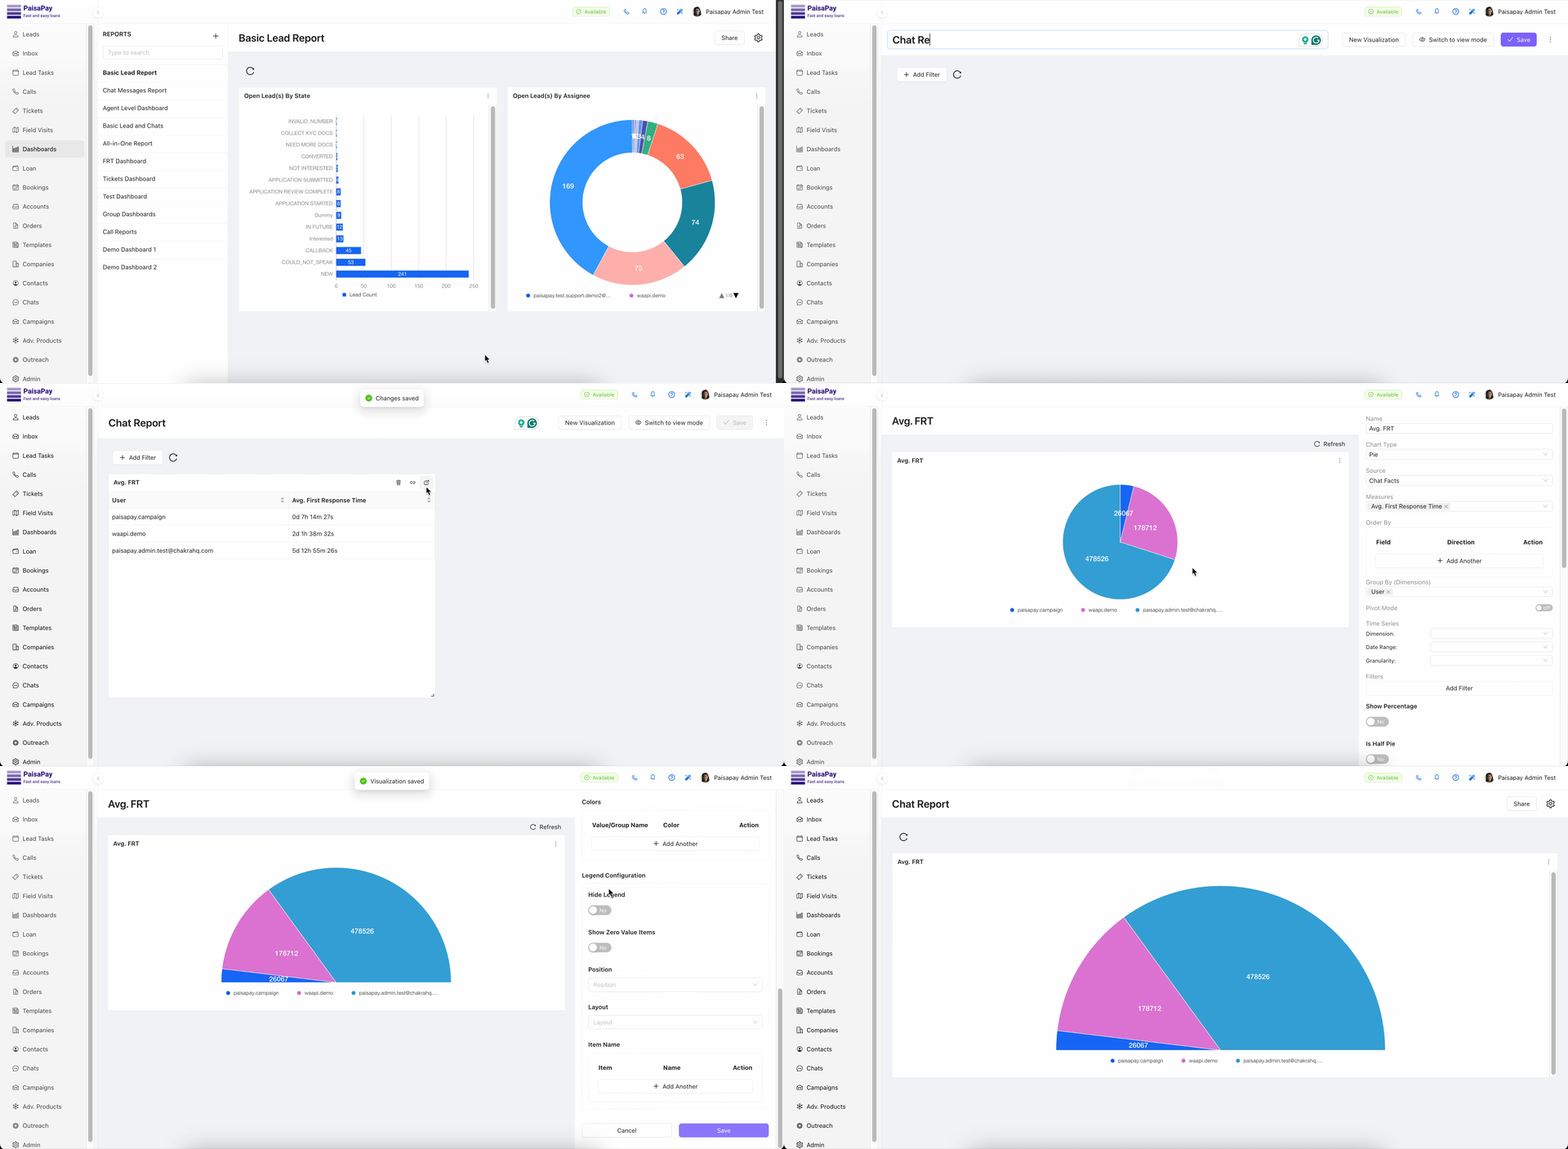
📊 How to create a chart dashboard?
This tutorial will guide you through setting up a dashboard with a chart visualization in Chakra.
🧱 Step 1: Create a Dashboard
- Go to the Dashboards List
- Click
Add New Dashboardto create a new dashboard - You'll be redirected to the new dashboard's page
- Rename the dashboard using the title bar in the top left
- Click
New Visualizationto add a chart
📈 Step 2: Add a Visualization
- A modal will appear with various visualization templates
- Choose:
Category:Chat
Template:Avg FRT X User - Click the
Usebutton - The visualization will be added to your dashboard
- Resize it by dragging the lower-right corner
- Click
Save(top right) to preserve your changes
🛠 Step 3: Modify a Visualization
Want to tweak the data or metrics behind a chart?
- Click the menu in the top right corner of the visualization
- Select Edit to open the visualization editor in a new page
- View and modify the query configuration
- Click
Runto preview the updated results - Make any changes you need and save when done

And that's it! You’ve successfully created and customized your dashboard with a powerful visualization in Chakra.